This is something that has been bugging me. Under the "National Graph" section on my Party Overview page, it reads:
"This graph shows the share of seats the party achieved in each election in the entire legislature, together with the share of other parties."
and shows this graph:
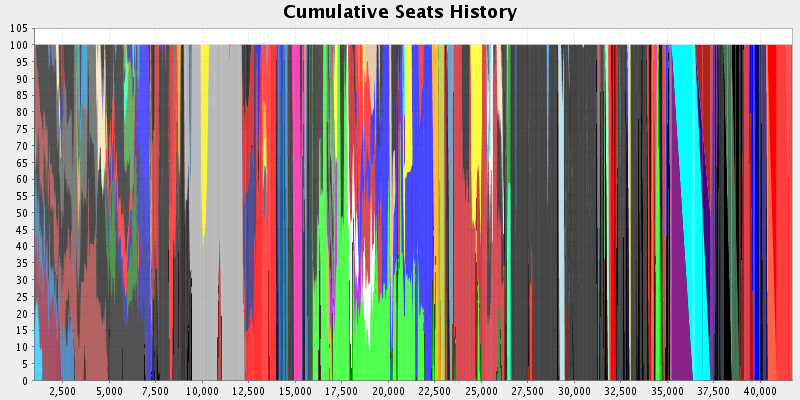
The y-axis goes from 0 to 100. I guess this is the percentage of seats each party has in the parliament/congress? But the x-axis counts by intervals of 2,500 and goes up to 30,000. But what do these numbers represent? Seats in parliament ?
From my party page, it looks like my party (in brown) starts at roughly 40-60 (y-axis) on 0 (x-axis), at one point narrows to 25-34 (y-axis) on 1,000 (x-axis) and ends at 0-22 (y-axis) on 3,000 (x-axis).
I have no idea what these numbers are supposed to mean or represent. Can anyone help me out here?
 Dorvik |
  Zardugal |
  Ostland (FBC)